
Is Microsoft ML.NET yet another machine learning framework?
In the world of data science and machine learning, Python programming language is making the rules. In addition to that, the existing frameworks like TensorFlow, Keras, Torch, CoreML, CNTK, are not easy to integrate with .NET projects.
ML.NET is built upon .NET Core and .NET Standard (inheriting the ability to run on Linux, macOS, and Windows) and it’s designed as an extensible platform, therefore you can consume models created with other popular ML frameworks (TensorFlow, ONNX, CNTK, Infer.NET). Microsoft ML.NET is more than machine learning, it includes deep learning, and probabilistics and you have access to a large variety of deep learning scenarios, like image classification, object detection.
Is Microsoft ML.NET data-friendly enough?
Python users have Jupyter Notebooks which is a great tool where you can integrate the markdown information, with code and with diagrams.
Until recently ML.NET did not have a good REPL (read–eval–print–loop) instrument to play interactively with code and data, but now, .NET developers can run on-premise interactive machine learning scenarios with Jupyter Notebooks using with C#, F#, or Powershell scripts in a web browser or in Visual Studio Code.
Prepare ML environment
There are several ways to get started using .NET with Jupyter. If you want to run Jupyter Notebooks locally, you have to install Jupyter Notebook on your machine using Anaconda. If you have successfully installed Jupyter Notebook you can launch it from the Windows menu to open/create a notebook.
Defining a practical scenario
Let’s suppose we have a system able to read temperature, luminosity, infrared, and distance to an energy source (the source might be a torchlight, a flashlight, a match, or an infrared torchlight). The observations are collected by sensors connected to an IoT device (Raspberry Pi 3) and we have a dataset consisting of a few hundred observations. These observations are labeled, which means we have a source for every observation in the dataset. We want to predict the source for a new observation.
Let’s jump into a Jupyter Notebook
One of the most important features of Jupyter, XPlot.Plotly, is a data visualisation library responsible for rendering some amazing diagrams.
Let’s fast forward and presume we have installed the libraries, initialized the machine learning context and loaded the training and testing datasets (some lines are removed for brevity).
#r "nuget:Microsoft.ML,1.4.0"
using Microsoft.ML;
using Microsoft.ML.Data;
using XPlot.Plotly;
private static readonly MLContext mlContext = new MLContext(2020);
Display command
In a Jupyter Notebook we can use Console.WriteLine to print data, but we will love display command since it’s able to print text, html, svn, and charts.
var features = mlContext.Data.CreateEnumerable<ModelInput>(trainingData, true);

display(features.Take(10));
Of course we don’t understand much looking at the tabular data but Jupyter brings up some great diagram types with XPlot.Plotly library able to aggregate the data in a more useful way.
Box Plot segmentation
If we need to see more information about our data we can use plot segmentation.
var featuresDiagram = Chart.Plot(new[] {
    new Graph.Box { y = featuresTemperatures, name = "Temperature" },
    new Graph.Box { y = featuresLuminosities, name = "Luminosity" },
    new Graph.Box { y = featuresInfrareds, name = "Infrared" },
    new Graph.Box { y = featuresDistances, name = "Distance" }
});

display(featuresDiagram);
Looking at the diagram we can extract valuable information like:
- the median bar from Distance is much higher comparing to the other features
- the min-max values from Temperature and Infrared are not uniformly distributed
- Temperature has many outliers
We can use this information later to improve the model’s accuracy, but now there is another thing which doesn’t look right, some features look “heavier” than others. Let’s see what happens if we try to bring all of them to the same scale, or to normalize them.
var preprocessingPipeline = mlContext.Transforms.Conversion.MapValueToKey("Label")
    .Append(mlContext.Transforms.CustomMapping(parseDateTime, null))
    .Append(mlContext.Transforms.Concatenate("Features", featureColumns))
    .Append(mlContext.Transforms.NormalizeMinMax("Features", "Features"));
The features are now normalized.
Correlation Matrix
Thinking of data, another question arises, do we really need all the features? Most probably some are less important than others. Correlation matrix is an excellent instrument able to measure the correlation between the features like it follows:
- near -1 or 1 indicates a strong relationship (proportionality).
- closer to 0 indicates a weak relationship.
- 0 indicates no relationship.
#r "nuget:MathNet.Numerics, 4.9.0"
using MathNet.Numerics.Statistics;

var correlationMatrixHeatmap = Chart.Plot(new Graph.Heatmap { x = featureColumns, y = featureColumns.Reverse(), z = z, zmin = -1, zmax = 1 });

display(correlationMatrixHeatmap);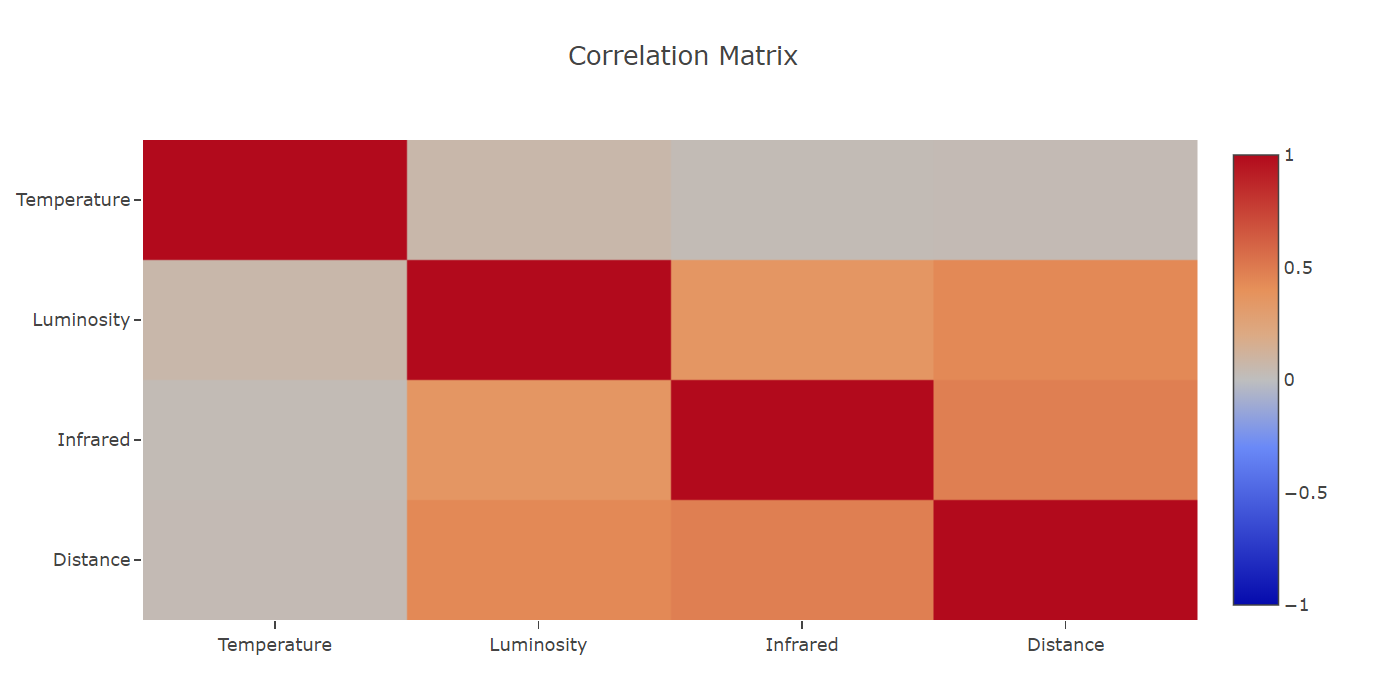
The strongly correlated features do not convey extra information, therefore they can be removed (it’s not the case here!).
For example, our most correlated features are Distance and Infrared (0.48), and Temperature seems to be the most uncorrelated feature compared with the other features.
Build the preprocessing pipeline
By convention, ML.NET is expecting to find Features column (as input) and Label column (as output), if you have such columns, you don’t have to provide them, otherwise you have to do some data transformations in order to expose these columns to the transformers.
In addition, if we need to do binary or multi classification, we have to convert the label to a number using MapValueToKey.
var featureColumns = new string[] { "Temperature", "Luminosity", "Infrared", "Distance" };
var preprocessingPipeline = mlContext.Transforms.Conversion.MapValueToKey("Label")
    .Append(mlContext.Transforms.Concatenate("Features", featureColumns));
In most cases we have more than one relevant feature that we need to concatenate into one, previously mentioned as Features.
Build and train the model
Now, we are ready to build the training pipeline using one of the multi-class classifiers, Stochastic Dual Coordinate Ascent (SDCA), but we might want to try other classifiers, as well.
var modelPipeline = preprocessingPipeline.Append(mlContext.MulticlassClassification.Trainers.SdcaNonCalibrated("Label", "Features"));
var postprocessingPipeline = modelPipeline.Append(mlContext.Transforms.Conversion.MapKeyToValue("PredictedLabel"));
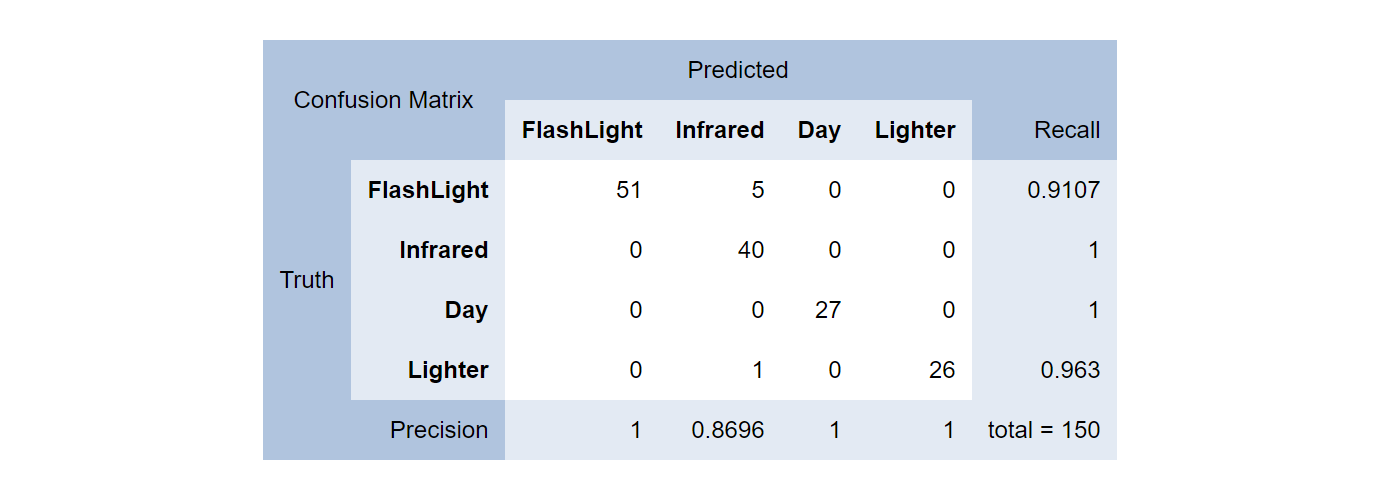
var model = postprocessingPipeline.Fit(trainingData);Confusion Matrix
After getting a model, the first thing to concern about should be the model performance and Confusion Matrix is an excellent performance measurement for machine learning classification.
Using the testing dataset we can make predictions and compare the predicted results to the actual results. In the previous diagram we can see the Infrared class was predicted correctly (as Infrared) for 40 times and incorrectly as FlashLight for 5 times, and Lighter one time, resulting in a 0.8696 precision rate.
Permutation Feature Importance
Another useful instrument is the Permutation Feature Importance (PFI) diagram. PFI computes the importance score for each feature by random permutations of the feature, resulting in more or less important features.
var pfi = mlContext.MulticlassClassification.PermutationFeatureImportance(linearPredictor, transformedData, permutationCount: 3);
var sortedMetrics = pfi.Select((metrics, index) => new { index, metrics.MacroAccuracy }).OrderBy(feature => Math.Abs(feature.MacroAccuracy.Mean)).Select(feature => feature.MacroAccuracy.Mean);
var pfiDiagram = Chart.Plot(new[] {
    new Graph.Bar { x = sortedMetrics, y = featureColumns.Reverse(), orientation = "h", name = "Permutation Feature Importance" }
});

display(pfiDiagram);
In our diagram the Distance feature seems to have a very low score. Dropping it will not significantly affect the performance of our model.
Conclusion
We have a platform and we have a set of instruments to iteratively improve the performance of our model. When we are pleased with the model accuracy, we can start to consume the model, making predictions using new data.
If you want to play with the Jupyter Notebook, you can find it at the address: https://github.com/dcostea/DotnetJupyterNotebooks